In the STEP 1 trial, once-weekly semaglutide 2.4 mg produced an average 14.9% body-weight reduction over 68 weeks versus 2.4% on placebo, and in SURMOUNT-1 tirzepatide produced 15.0% to 20.9% average loss over 72 weeks depending on dose, while real-world one-year results average lower, around 8.7%. That gap is the story coverage skips. Trial averages describe what happens under structured care with dose escalation and follow-up. Your result depends on whether your experience resembles that setting or the far messier one many people live in.
What GLP-1 Weight Loss Results Actually Look Like
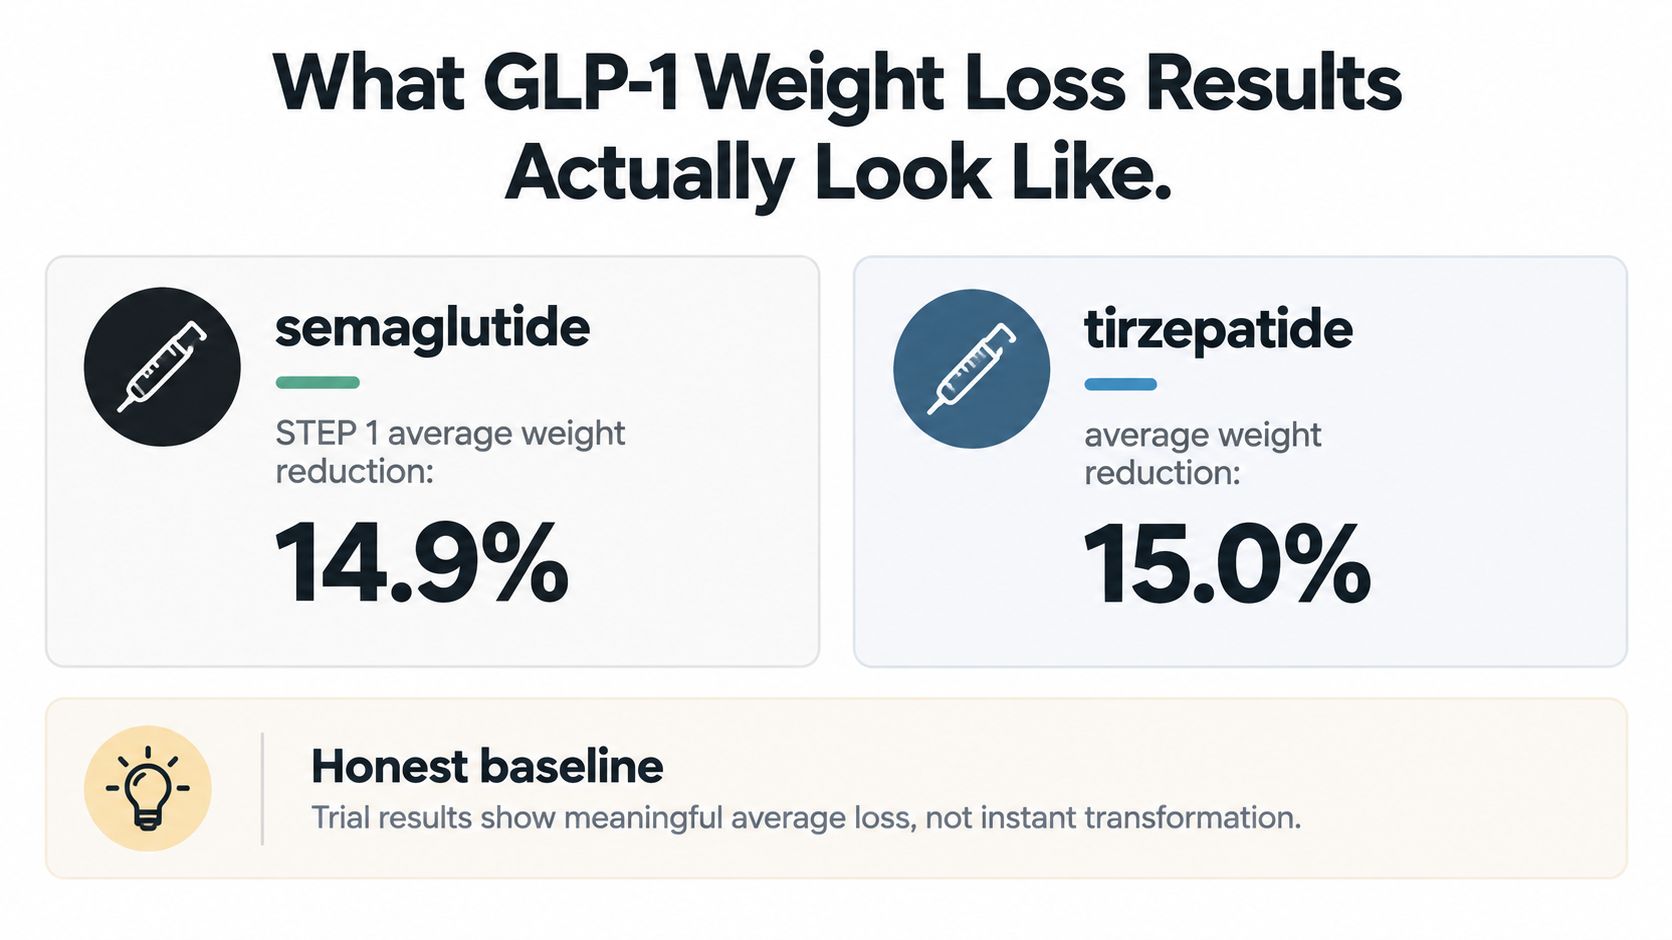
In the STEP 1 trial, semaglutide 2.4 mg reduced body weight by an average of 14.9% over 68 weeks, compared with 2.4% with placebo, alongside lifestyle intervention, according to results published in the New England Journal of Medicine. That average describes a group, not an individual outcome.
For scale, a person weighing 220 pounds who lost 14.9% of their starting weight would lose about 33 pounds. This is an illustration based on the trial average, not a prediction. Individual results vary, and real-world outcomes are often lower: a Cleveland Clinic study found an average loss of 8.7% at one year in routine care (study findings).
A Range, Not a Promise
The difference between trial and routine-care averages reflects more than the medication itself. Patients may reach different doses, have interruptions in treatment, or receive varying levels of help with side effects and follow-up. Those differences affect how long someone can continue treatment and how much weight they lose.
Dose and time on treatment shape results. Persistence connects the two: a dose has less opportunity to affect weight if treatment stops before escalation or maintenance. In routine care, therefore, the result depends partly on whether a person can sustain the treatment regimen, not only on which medication they start.
GLP-1 weight loss results are best understood as a range shaped by dose, duration, and continued treatment. Trial averages show what occurred under study conditions; real-world evidence gives a more cautious reference for planning.
How GLP-1 Medications Produce Weight Loss
Your gut releases a hormone called GLP-1 after you eat. It tells your brain you've had enough and slows how quickly food leaves your stomach. GLP-1 medications mimic that hormone at a stronger, longer-lasting level than your body sustains on its own.
Think of it as turning up the volume on a signal you already send. The message doesn't change. It gets louder and persists, so smaller portions register as sufficient and hunger returns more slowly. Many describe the practical effect plainly: they think about food less often, feel full sooner, and stop eating without the usual negotiation.

Why Eating Less Is the Whole Mechanism
These drugs don't burn fat directly, and that distinction shapes every result discussed here. Weight falls because energy intake drops and stays lower over months. A deeper primer on how GLP-1 works for weight loss covers the appetite and gastric-emptying pathways in full. The short version is that reduced hunger does the work, and your daily eating pattern converts that pharmacology into pounds.
That also explains individual variation. Two people can feel the same appetite suppression and lose different amounts, because their starting intake, food choices, activity, and metabolic history differ. If someone's weight is driven largely by factors other than hunger, quieting hunger helps less.
One Receptor Versus Two
Semaglutide activates the GLP-1 receptor alone. Tirzepatide activates GLP-1 plus a second gut-hormone pathway, GIP, which also influences appetite and metabolic signaling. That dual action is the conceptual reason tirzepatide's trial averages run higher, a comparison quantified later in this article.
The mechanism carries one consequence worth absorbing now. Because the effect depends on an ongoing amplified signal, stopping treatment restores your baseline hunger signaling. Nothing about the drug permanently rewires it. That single fact explains both the weight loss during treatment and the regain pattern after discontinuation, and it's why maintenance planning belongs in the first conversation, not the last.
The GLP-1 Results Timeline from First Dose to Maintenance
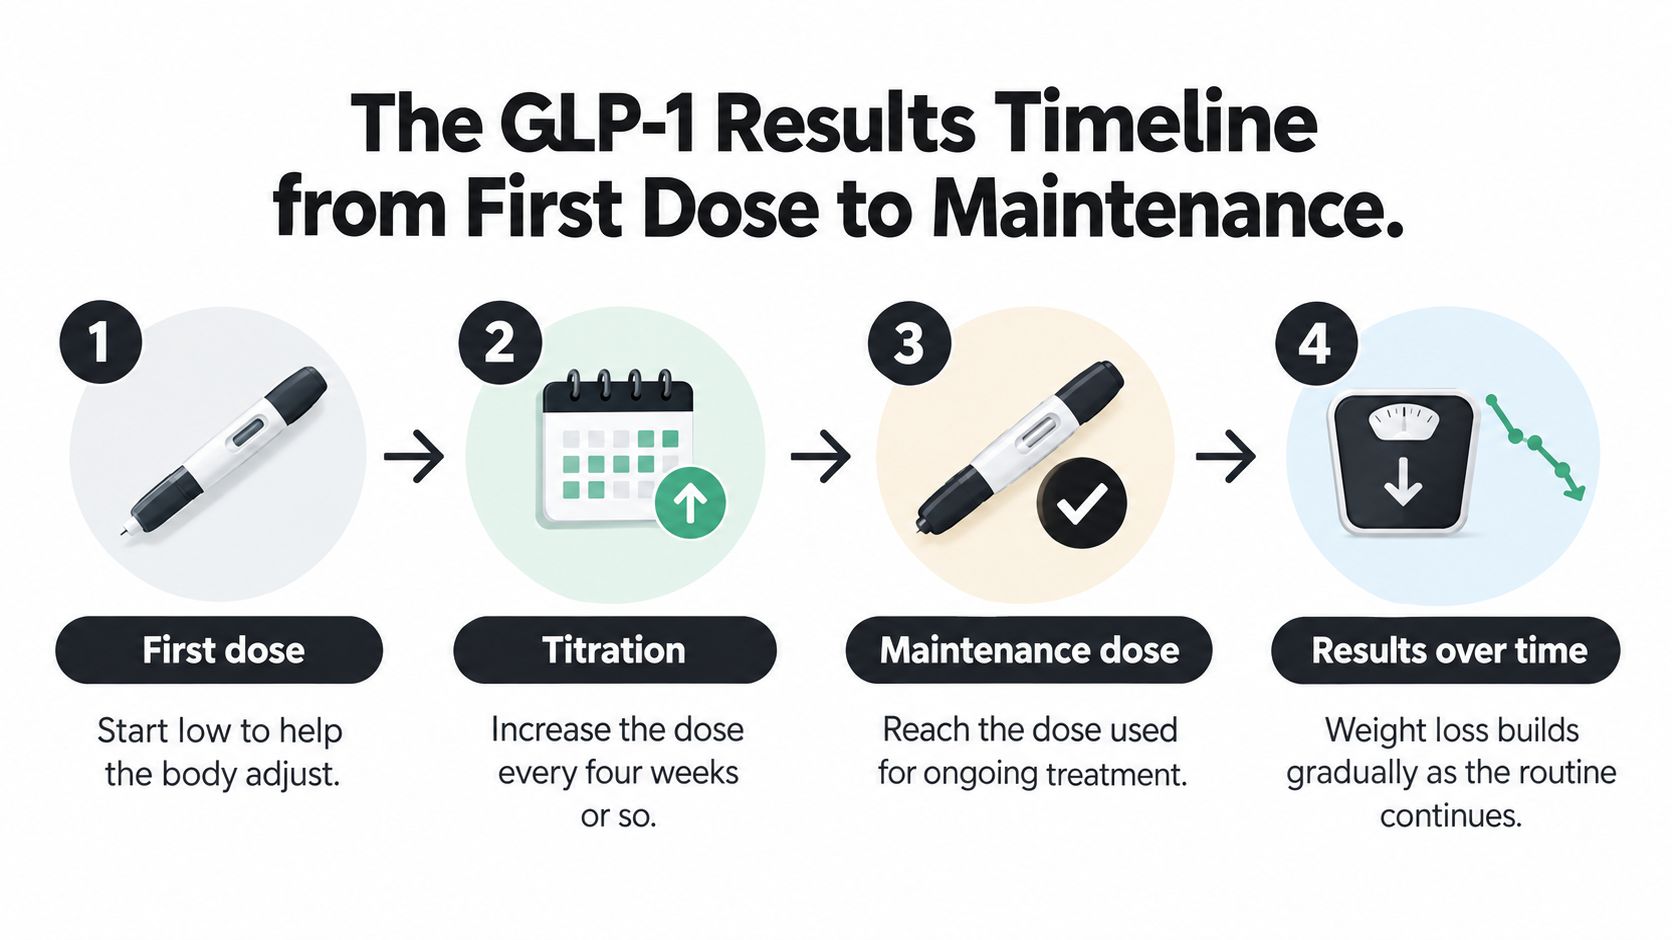
The first month is a tolerability exercise. Clinicians start low so nausea, early fullness, and bowel changes can settle before the dose is asked to do real work. Scale change during this phase is often small, and a flat few weeks usually means the schedule is doing its job.
Escalation then proceeds in steps, commonly about every four weeks when side effects allow. Each increase strengthens appetite suppression, but the benefit only counts if the dose stays in place. A pause forced by pushing too fast costs more momentum than a slower ramp.
Where the Steep Part of the Curve Sits
The consistent decline usually begins once dosing approaches the level intended for maintenance. Intake stays lower across consecutive weeks, and the cumulative deficit becomes visible. As noted earlier, peak loss tends to arrive late in treatment rather than in the opening stretch, which is why early weigh-ins carry limited information.
The practical marker is persistence: whether you reach a dose you can hold, then hold it long enough for the deficit to accumulate.
A slow first month says little about the endpoint. Early doses calibrate tolerance; maintained doses produce results.
What Bends Your Individual Curve
- Starting weight: Higher baseline weight can yield larger absolute losses at similar percentages.
- Tolerability: Symptoms that delay escalation push the steeper phase later.
- Adherence: Missed injections weaken appetite control during the period when consistency matters most.
- Eating pattern: The drug lowers intake pressure, but food choices still set the size of the deficit.
Plateaus near maintenance are expected physiology. As body mass falls, energy needs fall too, so the same intake creates a smaller gap. The objective then shifts from producing loss to defending it.
Semaglutide and Tirzepatide Results Compared by Dose
Dose drives most of the difference between these two drugs, and the brand debate tends to bury that point. In the SURMOUNT-1 trial published in the New England Journal of Medicine, tirzepatide averaged 15.0% at 5 mg, 19.5% at 10 mg, and 20.9% at 15 mg over 72 weeks, versus 3.1% on placebo. Semaglutide's STEP 1 average of 14.9% at 2.4 mg sits close to tirzepatide's lowest dose, not its highest.
Average Weight Loss by Medication and Dose in Trials
| Medication and Dose | Trial | Duration | Average Weight Loss | At Least 5% Loss | At Least 10% Loss |
|---|---|---|---|---|---|
| Semaglutide 2.4 mg | STEP 1 | 68 weeks | 14.9% | 86.4% | 69.1% |
| Tirzepatide 5 mg | SURMOUNT-1 | 72 weeks | 15.0% | 85.1% | 68.5% |
| Tirzepatide 10 mg | SURMOUNT-1 | 72 weeks | 19.5% | 88.9% | 78.1% |
| Tirzepatide 15 mg | SURMOUNT-1 | 72 weeks | 20.9% | 90.9% | 83.5% |
That spread between lowest and highest dose tells the story.
Threshold data sharpen the comparison. At tirzepatide 15 mg, 70.6% of participants lost at least 15% and 56.7% lost at least 20%, versus 9.5% and 3.1% on placebo in SURMOUNT-1. In STEP 1, 50.5% of participants on semaglutide 2.4 mg reached at least 15% loss versus 4.9% on placebo.
Reading These Numbers Honestly
A head-to-head breakdown of tirzepatide vs semaglutide for weight loss adds tolerability and practical detail to these averages. Two cautions apply before treating the table as a scoreboard. First, these were separate trials with different participants, so the comparison is indirect. Second, averages hide the spread, since both drugs produced participants with minimal response.
The overlap matters more than the gap. A patient who tolerates semaglutide at its full dose can achieve greater loss than someone who stalls at tirzepatide 5 mg, and the dose column above only describes people who stayed on treatment long enough to reach it. The practical question is which drug you can sustain at an effective dose for over a year.
Why Real-World GLP-1 Results Often Fall Short of Trials
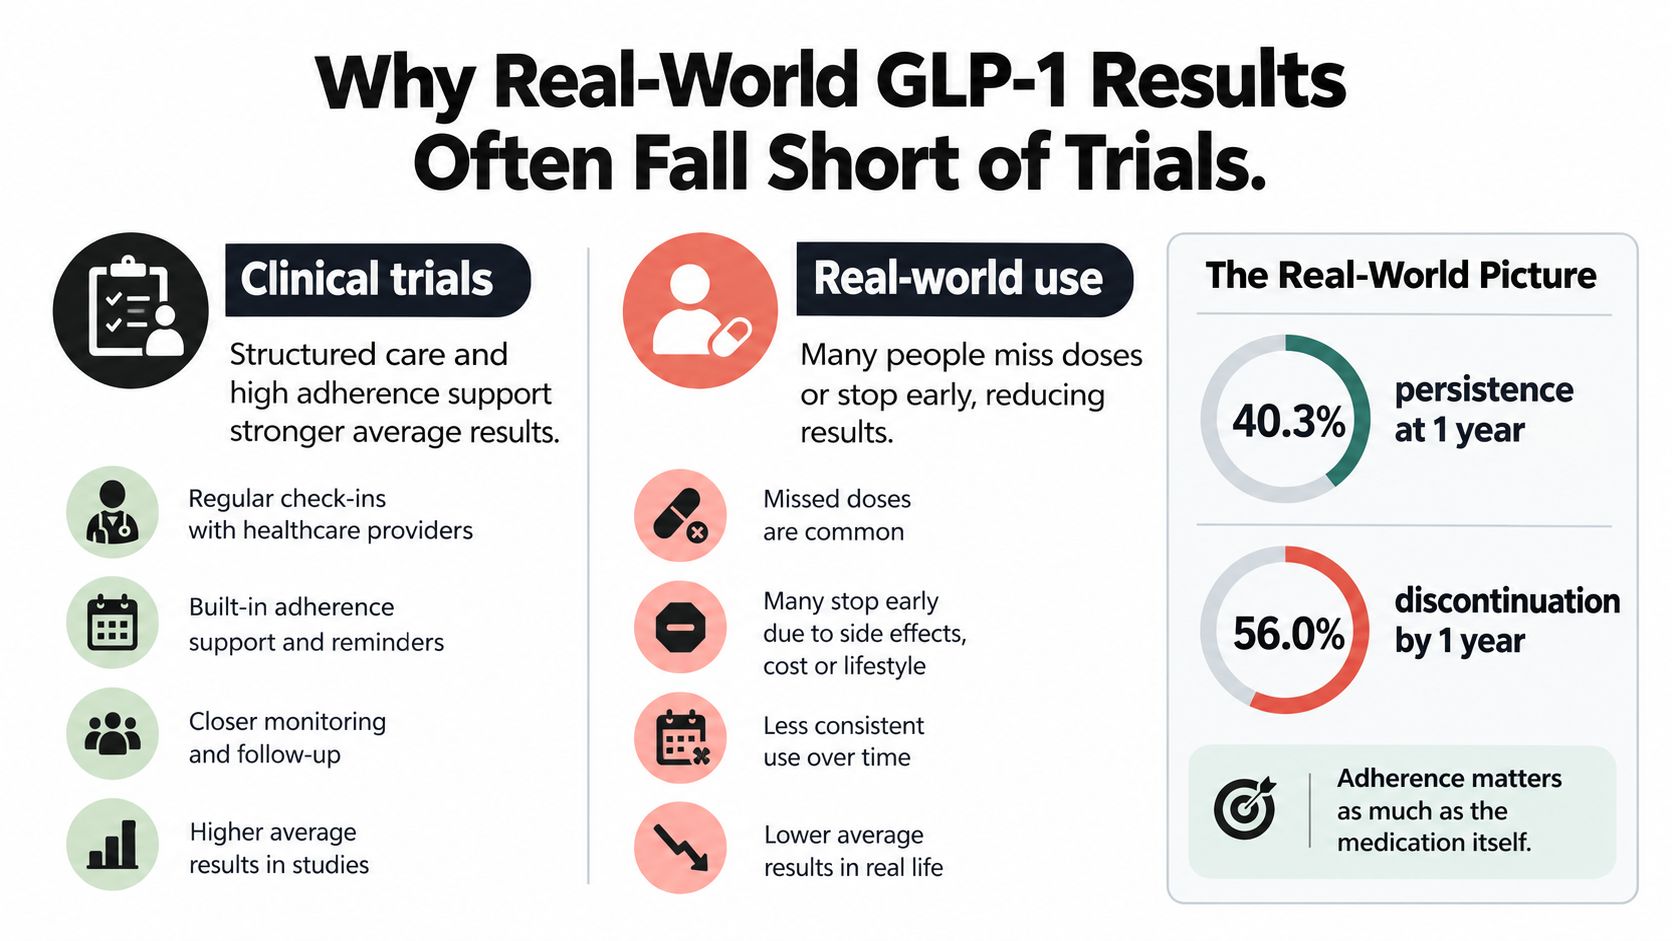
Trial averages describe a controlled exposure. Clinic averages describe an exposure that often ends early, and that difference explains much of the distance between the two.
As noted earlier, the one-year average was 8.7%, with 3.6% after early discontinuation, 6.8% after later discontinuation, 11.9% with continued treatment, and 13.7% or 18.0% among persistent higher-dose semaglutide or tirzepatide users. Read as one number, the result looks disappointing. Read by persistence, it becomes a map of delivered dose.
The Persistence Gradient
- Early discontinuation: loss stayed in the low single digits, consistent with too little exposure for the mechanism to compound.
- Late discontinuation: loss improved, yet remained well under what sustained dosing produced.
- Continued treatment: outcomes moved into double digits and began overlapping with trial expectations.
- Persistent, higher-dose use: the strongest real-world results sat closest to trial ranges, especially for tirzepatide.
That gradient is an exposure curve. Each month at an effective dose adds effect; each interruption removes it. Pharmacology still matters, and tolerability still decides who can climb. Where a patient lands in the range depends heavily on whether escalation survives cost, nausea, refills and follow-up.
Why People Actually Stop
The exits are mundane: coverage lapses, copay shocks, side effects managed without a clear plan, pharmacy shortages, and appointments that never get scheduled. Randomized trials design much of that friction out through protocol visits, reminders and rescue pathways. Routine prescribing often leaves the patient to solve the same problems alone.
Plan around adherence rather than hoping around it. Ask what happens if a dose is missed, if escalation stalls at a lower level, or if nausea or cost makes the next refill uncertain. A realistic GLP-1 result is the trial number discounted by the persistence you can sustain.
What to Expect Month by Month on GLP-1 Treatment
The first month is usually about tolerability, not a clear verdict on weight loss. Starting doses are intended to introduce treatment gradually. Appetite may decrease and portions may get smaller, while weight changes can remain modest. How you respond helps your clinician decide whether to increase the dose, hold it, or adjust the schedule.
During months two through four, many patients begin to see a clearer downward trend as doses rise. Appetite changes can make smaller portions easier to maintain. Dose increases may also bring back nausea or constipation, so tracking symptoms helps inform adjustments.
The Long Middle and the Peak
Months five through twelve often bring sustained progress as treatment approaches a maintenance dose and eating routines settle. Weight loss generally slows as body weight decreases and energy needs fall. An outcomes analysis published in 2025 found that weight loss tended to peak around 12 to 18 months. A plateau during this period does not, by itself, show that the medication has stopped working.
With lower appetite, adequate nutrition can take more planning. Protein-rich snacks for weight management can help maintain protein intake on days when full meals are difficult. If side effects or poor intake emerge, discuss the dose and escalation schedule with your provider rather than making changes on your own.
What to Track Each Month
- Weight trend: Compare weekly averages rather than daily readings.
- Dose and tolerability: Record your current dose and symptoms after increases.
- Appetite pattern: Note changes in fullness and how long they last.
- Nutrition and fluids: Track whether you are eating and drinking adequately, especially on low-appetite days.
If your weight trend remains unchanged for several weeks, review it with your provider. Dose, missed or delayed doses, and changes in energy needs may all contribute, and the right response depends on the cause.
How Supervised GLP-1 Programs Support Better Results
Two patients start the same medication in the same week. One leaves with a prescription and a follow-up months away. The other leaves with scheduled check-ins, dose adjustments when side effects flare, and someone to message when nausea or a supply gap threatens the routine. The persistence data covered earlier predicts which one lands nearer the top of the results range.
The case for supervision is mechanical rather than pharmacological. The molecule works the same way in both patients, so the difference has to come from the environment around it. In the analysis discussed earlier, that environment is what separated the 8.7% average loss across all users from the 13.7% and 18.0% reached by patients who stayed on higher doses for a full year.
What Structured Care Adds That a Prescription Does Not
| Program element | What it prevents |
|---|---|
| Scheduled follow-up | Problems surfacing only after discontinuation |
| Flexible dose escalation | Quitting outright when a step is poorly tolerated |
| Side-effect guidance | Nausea and low intake ending treatment early |
| Transparent pricing | Mid-course cost surprises |
| Home delivery | Pharmacy friction and missed refills |
None of these elements is complicated. Each one removes a specific, documented reason people stop taking a medication that was still working.
Weight Method illustrates the telehealth version of this model. A brief online quiz and a video visit with a licensed provider start the process, after which the program ships FDA-approved semaglutide or tirzepatide to your door with ongoing consultations, unlimited messaging, progress tracking, and personalized dose adjustments. Pricing starts at $149 per month with FSA and HSA eligibility, and the program reports 12 lbs lost in the first month on average and 18% average weight loss over time, according to its GLP-1 weight loss program overview.
Those program figures deserve a different reading than trial data. They are self-reported outcomes from people who stayed engaged, which makes them evidence of the same mechanism described above rather than proof of superior results. A supervised program does not raise the ceiling on what a GLP-1 can do. It raises the odds that you stay on the dose long enough to reach it.
Planning for Maintenance and Your Next Step
Everything above converges on one uncomfortable fact: GLP-1 weight loss is treatment-dependent. The STEP 1 extension data cited earlier shows what happens when treatment stops. Participants who discontinued semaglutide after 68 weeks regained 11.6 percentage points of lost weight over the following year, versus 1.9 points on placebo. By week 120, net mean loss from baseline had narrowed to 5.6% with prior semaglutide against 0.1% with placebo, and cardiometabolic improvements drifted back toward baseline as weight returned. A separate discontinuation analysis, also discussed above, estimated that regain begins within weeks of stopping and proceeds at roughly 0.55% of original body weight per month.
Regain is the predictable return of baseline appetite signaling once the amplified signal stops.
That framing changes how you should plan. Stopping is a transition, and transitions need a strategy built before you reach them. A workable maintenance plan may involve continued treatment at a stable dose, a clinician-guided taper, structured nutrition, resistance training to protect lean mass, and follow-up that watches appetite and weight after any dose change. Set that approach with your provider at the start, and set your target from the realistic results range rather than the headline percentage. The persistence data throughout this article point to one conclusion: where you land in that range depends less on which molecule you take than on how long you stay on it.
If you're ready to pursue GLP-1 treatment with the follow-up structure that persistence data support, Weight Method offers FDA-approved semaglutide and tirzepatide through licensed providers, with medication shipped to your door and ongoing dose support built into every plan. Take the brief online quiz, meet your provider by video, and set a target based on the realistic results range rather than the headline number.